| Feed Water | Complete source-water analysis | Obtain laboratory results for TDS, conductivity, pH, hardness, alkalinity, turbidity, iron, manganese, silica, chloride, sulfate, temperature, microbiology and oil contamination. | RO performance, membrane life and pretreatment requirements depend directly on feed-water chemistry. | Require a recent laboratory report and confirm that the design calculations use the same water source and temperature range. |
| Capacity | Product-water flow | Define average, peak-hour and seasonal demand separately. Size the plant for the required peak demand rather than only the daily average. | A plant sized only for average demand may fail to supply water during peak operating periods. | Check the design flow in m³/h and m³/day, operating hours, storage volume and the assumed feed-water temperature. |
| Capacity | Future expansion | Reserve space, pipe connections, electrical capacity and pretreatment allowance for additional membrane vessels or a parallel skid. | Expansion is usually less disruptive and less expensive when included during the initial installation. | Ask for a layout showing expansion zones, spare connection points and the additional load available from pumps and control panels. |
| RO Performance | Salt rejection | A properly selected brackish-water RO membrane commonly provides approximately 95–99% salt rejection under specified test conditions; actual results vary with water chemistry, pressure, temperature and membrane age. | Salt rejection determines the permeate conductivity and suitability for the intended application. | Request a projection showing feed TDS, permeate TDS or conductivity, recovery, pressure and temperature assumptions. |
| RO Performance | System recovery | Brackish-water systems commonly operate around 50–75% recovery. Seawater systems are often designed around 35–50%, depending on salinity, scaling risk and membrane configuration. | Higher recovery reduces reject-water volume but increases concentration, scaling risk and pretreatment demands. | Verify the recovery calculation, reject-flow rate, antiscalant strategy, concentration limits and permitted discharge method. |
| Pretreatment | Suspended solids control | Design should control turbidity and colloids before the membranes. An SDI15 target below 3 is commonly used for demanding RO applications, while SDI15 below 5 is a widely referenced upper operating limit. | Particles and colloids can cause membrane fouling, pressure loss and shortened cleaning intervals. | Confirm the multimedia filter, cartridge filter rating, backwash arrangement and the planned SDI or turbidity monitoring method. |
| Pretreatment | Disinfection compatibility | Polyamide RO membranes are chlorine-sensitive. If chlorination is used upstream, residual chlorine must be removed before the membranes, normally by activated carbon or an approved chemical dechlorination process. | Oxidant exposure can permanently damage common RO membrane materials. | Check chlorine monitoring points, carbon contact time or dosing calculations, and the supplier’s membrane compatibility documentation. |
| Pretreatment | Scaling control | Evaluate calcium carbonate, calcium sulfate, barium sulfate, strontium sulfate, silica and iron fouling potential. Use softening, antiscalant, pH adjustment or another suitable control method where required. | Scaling reduces permeate flow, increases operating pressure and may require premature membrane replacement. | Require a scaling projection based on the actual analysis and the selected recovery, temperature and membrane elements. |
| Energy | Specific energy consumption | Typical indicative ranges are approximately 0.5–2.5 kWh/m³ for brackish-water RO and about 2.5–5.5 kWh/m³ for seawater RO; site conditions and energy-recovery equipment can change these values. | Energy consumption is a major part of the plant’s lifetime operating cost. | Compare guaranteed or calculated kWh/m³ at the stated feed pressure, temperature, recovery and product flow. |
| Equipment | High-pressure pump selection | The pump should provide the required flow and pressure at the design point, with materials compatible with feed-water salinity and chemical exposure. | Pump efficiency and reliability affect production stability, energy cost and maintenance frequency. | Review the pump curve, motor efficiency, wetted materials, seal type, variable-frequency drive and spare-parts availability. |
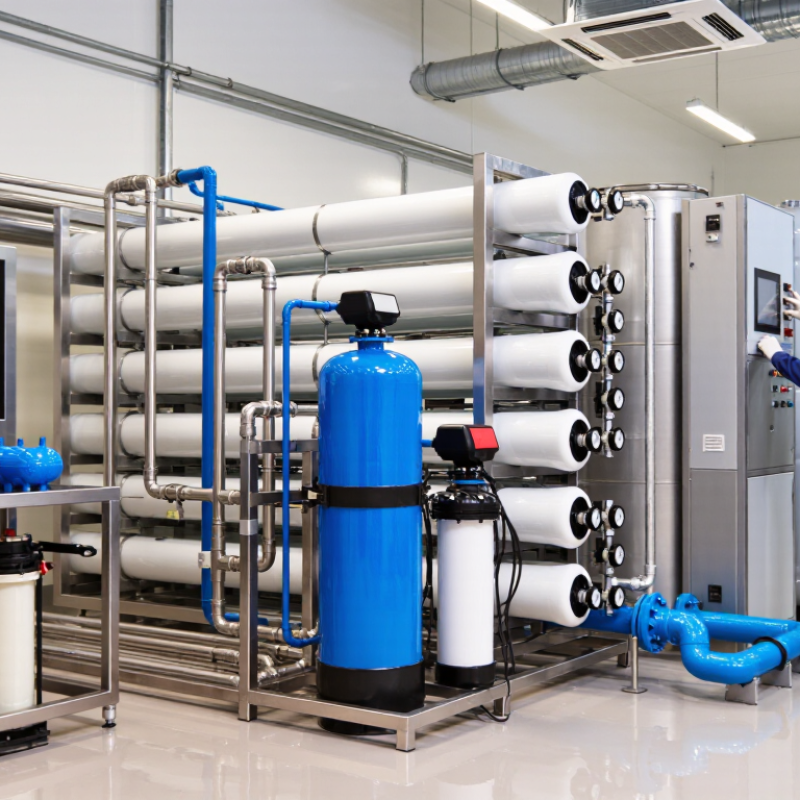
| Equipment | Membrane arrangement | Confirm the number and size of pressure vessels, membrane elements per vessel, staging arrangement, design flux and allowable pressure drop. | The arrangement determines recovery, permeate quality, hydraulic balance and future maintenance requirements. | Request a membrane projection from recognized design software or an equivalent engineering calculation, without relying only on nominal pump capacity. |
| Controls | Instrumentation and alarms | At minimum, monitor feed and permeate flow, feed and reject pressure, conductivity, pH where relevant, tank levels, temperature and key pretreatment pressures. | Accurate monitoring allows operators to detect fouling, leaks, scaling and product-water quality changes early. | Check the instrument list, calibration points, alarm limits, automatic shutdown logic and data-logging capability. |
| Product Water | Post-treatment requirements | If the water is intended for drinking or distribution, evaluate remineralization, pH stabilization, final disinfection and hygienic storage. RO permeate may be low in alkalinity and minerals. | RO alone may not provide stable, corrosion-controlled or microbiologically protected water for every application. | Match post-treatment to the applicable local drinking-water requirements and the final use of the water. |
| Installation | Floor, drainage and access | Provide a level, load-bearing floor; adequate drainage for backwash, cleaning and accidental leaks; safe access around vessels; and sufficient clearance for cartridge and membrane replacement. | Restricted access and poor drainage increase maintenance time and can create safety or hygiene problems. | Approve a dimensioned general arrangement drawing and verify equipment-removal routes before delivery. |
| Installation | Utilities | Confirm feed-water pressure, electrical voltage and frequency, compressed air if used, chemical storage, ventilation, ambient temperature and reject-water discharge capacity. | Utility mismatches can prevent commissioning or cause unstable operation. | Use a site-utility checklist and obtain written confirmation of required flow, pressure, power, drainage and chemical connections. |
| Installation | Electrical and safety compliance | Use appropriately rated control panels, grounding, emergency stops, motor protection, chemical handling controls and electrical equipment suitable for the installation environment. | Correct protection reduces risks from electric shock, chemical exposure, overpressure and dry running. | Review single-line diagrams, control-panel documentation, local electrical requirements and risk assessments before installation. |
| Supplier | Engineering documentation | The supplier should provide a process flow diagram, piping and instrumentation diagram, equipment schedule, datasheets, layout drawing, electrical drawings, operation manual and maintenance schedule. | Complete documentation supports installation, troubleshooting, operator training and future upgrades. | Make document delivery a contractual milestone rather than accepting only a quotation and equipment list. |
| Supplier | Performance guarantee | The contract should define product flow, permeate conductivity or TDS, recovery, operating pressure, energy consumption where applicable and test conditions. | Clear acceptance criteria prevent disputes between nominal equipment capacity and actual plant performance. | Specify feed-water quality, temperature, test duration, measurement method and remedies if the agreed values are not achieved. |
| Supplier | Factory and site acceptance testing | Use factory checks for assembly, wiring, instruments and controls, followed by site testing under representative feed-water conditions. | Testing at both stages identifies manufacturing defects and confirms real installation performance. | Prepare signed FAT and SAT checklists covering leaks, interlocks, alarms, flow, pressure, conductivity and automatic sequences. |
| Maintenance | Cleaning and membrane replacement plan | Provide chemical cleaning connections, compatible cleaning chemicals, cleaning procedures, spare cartridge filters, critical seals and a membrane replacement strategy. Membranes may commonly last about 3–7 years when properly operated, but actual life varies. | Fouling control and planned maintenance are more cost-effective than operating until irreversible damage occurs. | Request cleaning triggers based on normalized permeate flow, salt passage and pressure drop, plus a recommended spare-parts list. |
| Operating Cost | Total cost of ownership | Compare capital cost with electricity, chemicals, replacement filters, membrane elements, labor, testing, wastewater handling and scheduled service over the planned operating period. | The lowest purchase price may result in higher lifetime cost if energy use, downtime or consumables are excessive. | Evaluate at least a five-year operating-cost model using the same flow, operating hours, recovery and utility assumptions for every proposal. |